Part 1: What is Data Journalism?
It’s about using the power of data. They key information and data is important of the process of it. You are enables to do an interactive map, rather than being confined and restricted to just text or image based articles. Data Journalism gives you the power to interpret information visually, giving the designer a controlled environment of what they want the reader to focus more on.
“Journalism is the recognition of the power of measurement.”
– Professor Christoforos Anagnostopoulos
In this video provided by The Guardian, journalists defined what data journalism means and highlighted the importance of it in journalism. It plays a key role in giving an insight to relevant and important articles that text based articles cannot do. It basically is a ‘modern way’ of journalism, not just putting out opinions but it is of actual factual information within that data visualisation.
Part 2: History of Data Journalism at The Guardian
Journalist have been trying to battle with data journalism since the beginning of time and have attempting to present data in an interesting way to the reader in order to attract them.
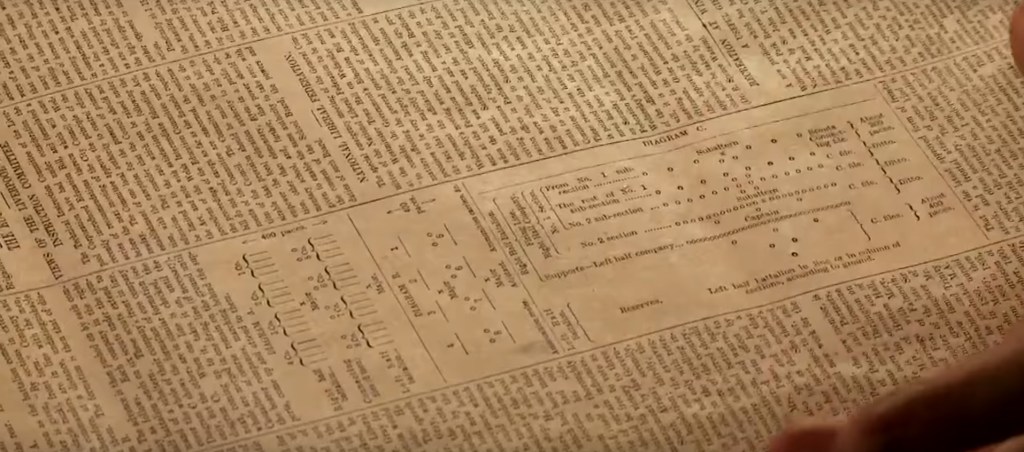
An example of the attempt was in the 1821 of The Manchester Guardian, seen using the new brigade structure of the South African Tactics. This graph was implemented in between the cluster of texts. There were some elements of design and type, every easy and simple attempt at data visualising.
Part 3: Data journalism in action: the London Olympics
People were obsessed about the Olympics and liked to keep track of which countries had obtained more medals in medal tables. This is when data journalism took in place of tracking these numbers of medals according to each country, allowing people to compare the information being given through a graph.
The Guardian had attempted to showcase this data but there were some inconsistent information, so that’s when real statistical information comes into contact to enable an efficient graph.
